Atrium Analytics Platform
Role
Lead Product Designer
For
Atrium HQ
Date
2016
Type
Data Visualization / ML / SaaS
URL

Atrium's Sales Performance Management application (code named Catalyst) is designed to help sales teams and managers leverage data to improve their performance effectively. It's a tool that simplifies the analysis of complex data sets, enabling teams to identify performance trends and opportunities through an easy-to-use interface.
The core of Atrium's offering is its ability to automatically track key performance indicators (KPIs), giving sales managers a detailed view of how individuals and teams are performing. This functionality helps pinpoint where improvements are needed and where strategies are working well. The platform uses machine learning to provide insights and recommendations, making it simpler for managers to set goals and guide their teams toward higher productivity and better results.
Addressing the challenge of making complex data accessible, the project focused on creating an interface that's both intuitive and visually appealing. The design emphasizes straightforward visuals, clear metrics, and color coding, making it easier for sales representatives to understand and act on the data presented. The platform has seen rapid adoption, with over 200 companies using it to drive sales performance.
This project, spanning six months, included developing both a desktop and mobile application, along with thorough design documentation to ensure a consistent and effective implementation across different platforms.
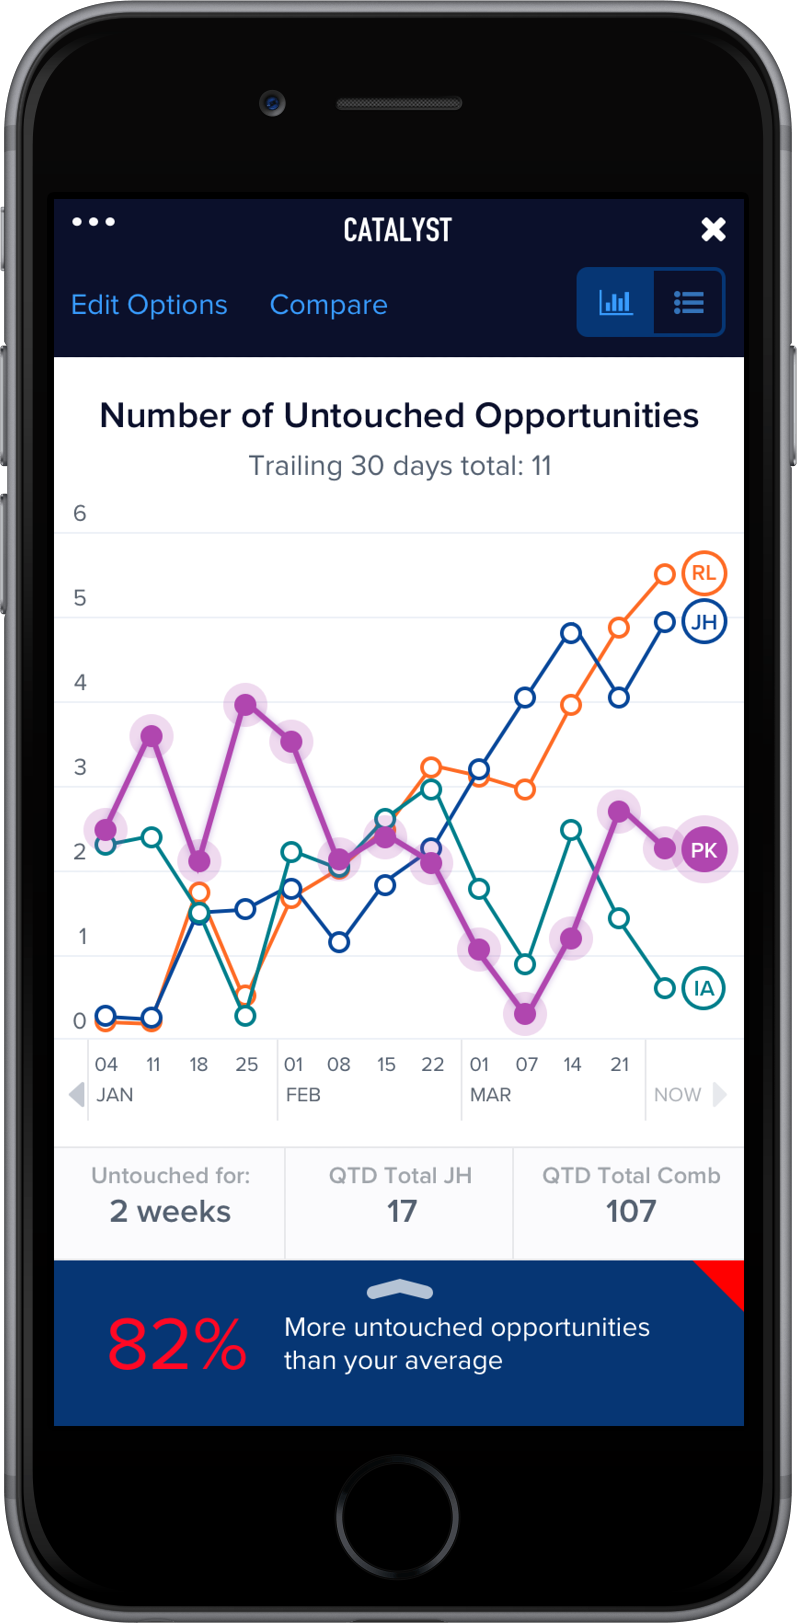
Detailed Time-Based Analysis: A deep dive into a specific team KPI over time, showcasing Atrium's capability for granular performance insights.
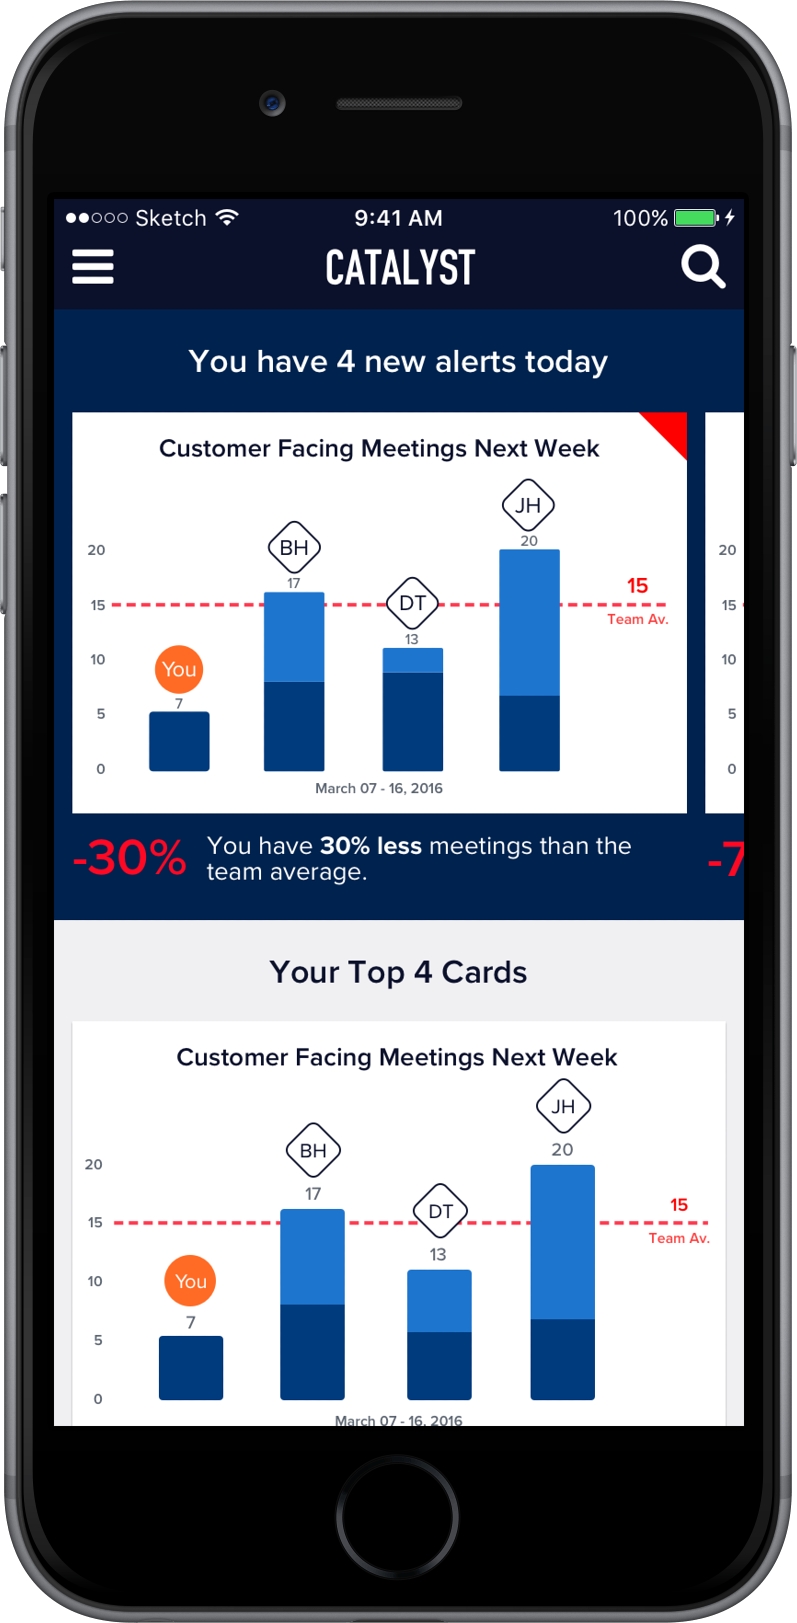
Atrium's Dashboard Across Devices: Shows detailed sales KPIs on both mobile and desktop, facilitating analysis and performance tracking in any setting.
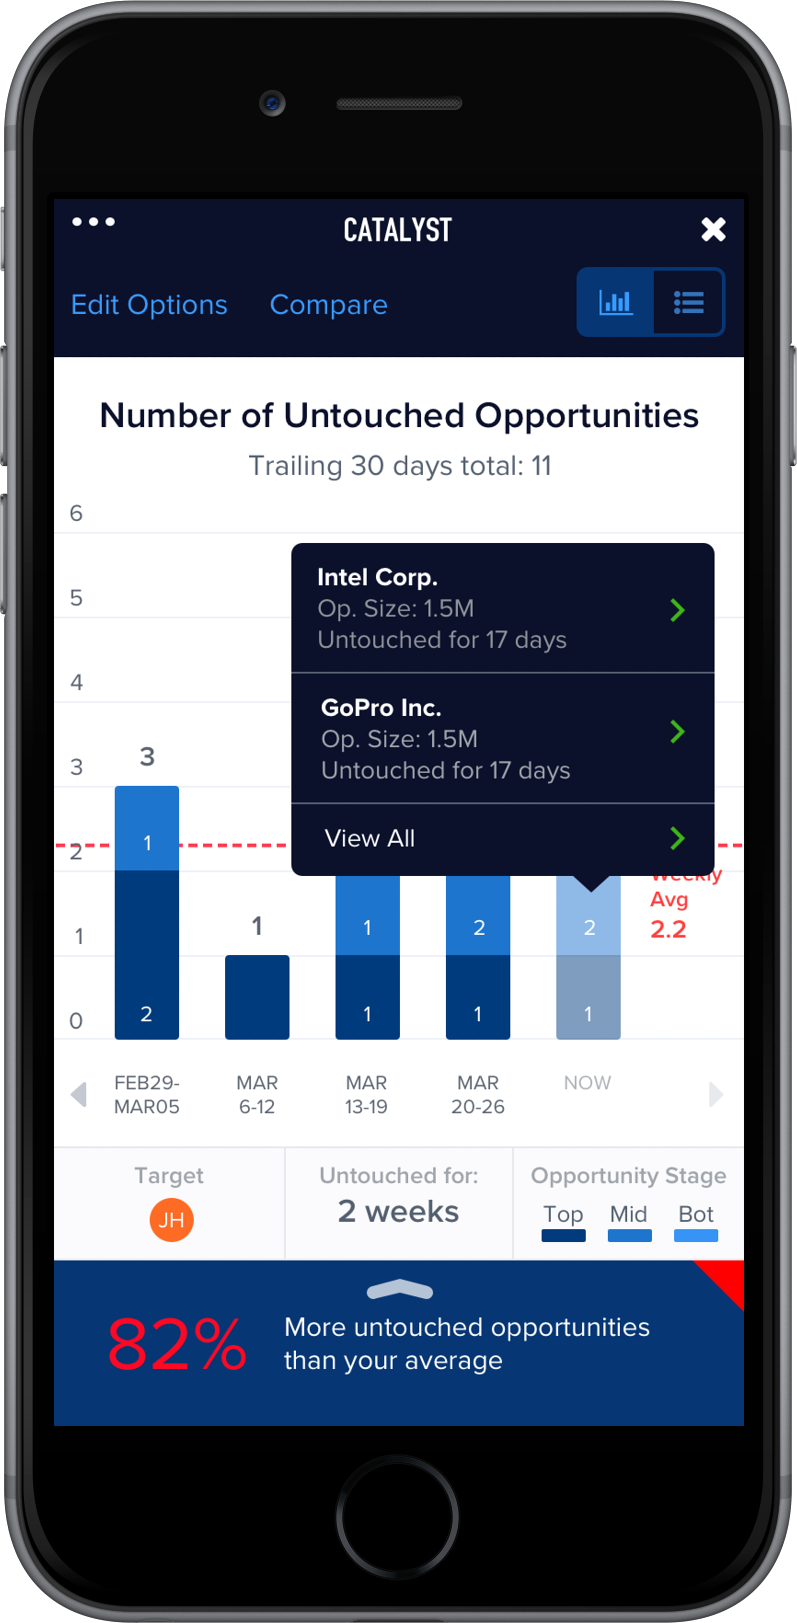
Atrium streamlines tracking and analyzing key sales metrics with a user-friendly interface. Its in-depth KPI library and intuitive data exploration tools, like clickable charts and dynamic filters, empower users to gain meaningful insights effortlessly.
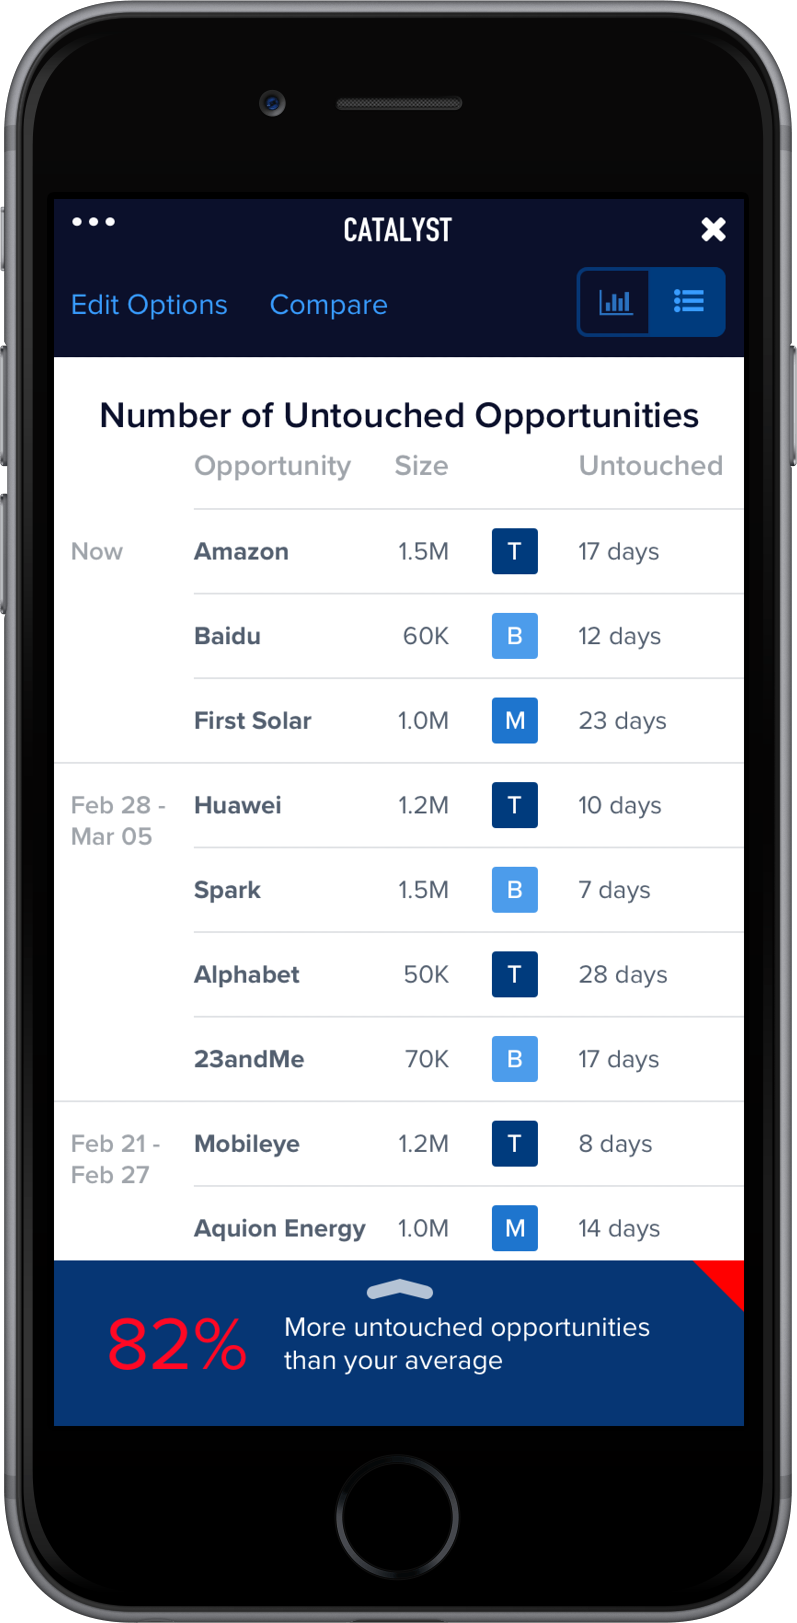
Customized visualizations for various data types make it easier for users to quickly grasp insights and facilitate informed decisions.
Atrium's design documentation, outlining visual and interactive elements, simplifies UI development and implementation. This lays the groundwork for future updates, ensuring the app can adapt and improve over time within a well-defined framework.


